What to Consider Before Replacing Your Old Mill?
Source:clirikb
Posted:2026-09-10

1.Work Out Your Old Mill’s Real Annual Cost
Many people only look at the new mill’s price tag. They ignore hidden costs of the old machine. You should work out a full list of numbers first.| Issue Category | Key Indicator | Typical Data / Findings | Business Impact |
| Unit Power Consumption | Electricity used per ton of powder | Old mills typically run 30–50% higher power per ton than new models | Consumes a significant portion of annual profit |
| Downtime Loss | Monthly breakdown hours; lost output and profit | Unplanned stops can cause 10–15% loss of annual output | Disrupts production rhythm; raises defective product rate |
| Maintenance Cost | Annual wear part replacement and routine repair fees | Repair costs first rise to about 30% of replacement cost, then jump to 50% in the following year (the "50% rule") | When repair cost exceeds half the price of a new machine, replacement is usually more cost-effective |
| Quality Loss | Losses from returns and defective products caused by unstable particle size or over-limit coarse particles | Old mills with poor classification have wider particle size distribution (PSD) | More customer complaints; restricts entry into high-end product markets |
First, unit power consumption.
Figure out how much electricity your old mill uses per ton of powder. Compare it with the current industry mainstream level.Usually, old mills usually run 30–50% higher power per ton than new models. This part alone can eat up a lot of profit every year.
Second, downtime loss.
Count how many hours your old mill breaks down every month. Calculate how much output and profit you lose during shutdowns. Frequent small failures also disrupt production rhythm and raise defective rate.Some old lines lose 10–15% of annual output to unplanned stops.
Third, maintenance cost.
Add up wear part replacement and routine repair fees for a whole year.Repair costs usually rise as equipment ages. Industry experience shows repair costs first rise to about 30% of replacement cost. Then they jump to 50% in the following year. That is the common 50% rule for equipment replacement.
When repair cost exceeds half the price of a new machine, replacement is usually more cost-effective.
Fourth, quality loss.
Count losses from returns and defective products.These are caused by unstable particle size or over-limit coarse particles. Old mills with poor classification usually have wider particle size distribution(PSD).
They cause more complaints from downstream customers.
They also hold you back from entering high-end product markets.
Add all these up. You get the real annual cost of keeping your old mill.
Many plant owners are surprised after the calculation. Some old mills cost more per year than the installment of a new machine.

2.Check trade-in policy details carefully
Trade-in policies look simple on the surface. While, a lot of detailed conditions hide inside. You need to clarify a few key points in advance. Don’t wait until you sign the contract to find surprises.| No. | Key Question | Details / Considerations |
| 1 | How is the old mill valued? | Is it priced by on-site assessment or a fixed percentage of the new machine price? Some suppliers set a very low trade-in value, so the so-called discount may offer no real benefit. You are free to contact us for clarification. |
| 2 | Who pays for old mill dismantling, lifting, and transportation? | Heavy grinding mills need professional teams to take apart and move. These fees can add up significantly. Clarify in advance who bears the cost. |
| 3 | Is there a minimum purchase amount requirement? | Some trade-in policies only apply when you buy above a certain amount. Small-scale upgrades may not qualify. |
| 4 | Can the trade-in credit stack with other new machine discounts? | Many suppliers do not allow stacking. You need to compare the final price, not just the trade-in amount. |
| 5 | Is the new machine warranty affected by the trade-in deal? | Some trade-in packages come with shorter warranty terms or exclude certain free services. Skipping these details often leads to disputes later. |
First, how is the old mill valued.
Is it priced by on-site assessment, or a fixed percentage of the new machine price. Besides, you are free to contact us.Some suppliers set a very low trade-in value for old machines. The so-called discount is actually no real benefit.
Second, who pays for old mill dismantling, lifting and transportation.
Heavy grinding mills need professional teams to take apart and move. These fees can add up to a lot. Clarify who bears the cost in advance.Third, whether there is a minimum purchase amount requirement.
Some trade-in policies only apply when you buy above a certain amount. Small-scale upgrades may not qualify.Fourth, whether the trade-in credit can stack with other new machine discounts.
Many suppliers do not allow stacking. You need to compare the final price, not just the trade-in amount.Fifth, whether the new machine warranty is affected by the trade-in deal.
Some trade-in packages come with shorter warranty terms. Or they exclude some free services.Skipping these details often leads to disputes later.
3.Don’t just replace the main mill unit

Many people think replacing the main host is enough. That is usually not the case.
New mills run with higher efficiency and higher speed. Old supporting equipment cannot keep up. The whole line still fails to reach expected output and precision. You spend the money for a new mill, but you don’t get the full benefit.
You need to evaluate compatibility of all supporting equipment. This includes classifiers, dust collectors and control systems. Also check workshop space, power supply capacity and feeding/conveying systems.
For example, a new high-efficiency mill needs matching air volume from the high-pressure air blower. Old fans with insufficient air volume will directly limit output. Old dust collectors may fail to handle higher powder concentration. They usually cause emission problems and product loss.
Besides, labor cost stays high. Old control systems may not support fine parameter adjustment of the new mill. You still need manual operation on site.
Add these supporting renovation costs into your total budget. Otherwise you will easily go over budget and still miss performance targets. If most supporting equipment is also old, a full line upgrade may be more cost-effective than only replacing the main unit.
4.Figure out the actual payback period
The core of any equipment upgrade is how fast you earn your money back. Do not rely only on advertised ideal parameters. Calculate based on your actual working conditions.Count all core gains from the new mill. Especially the electricity cost.
Let’s take a brief comparison to illustrate.
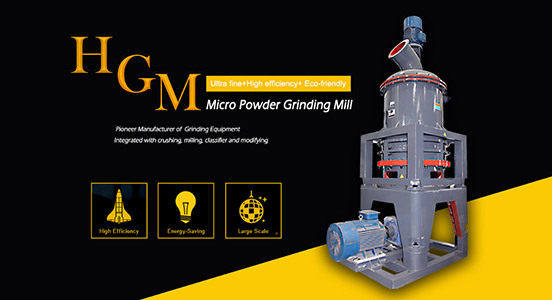
Conventional Ball mills typically see output drop by 40–60% when fineness increases from 325 mesh to 1250 mesh, with unit power consumption surging by 50% or more, which may up to 40-55 Kwh.
| Model | HGM80 | HGM80A | HGM100L-Ⅱ | HGM100P | HGM125L | HGM1680L |
| Ring Diameter(mm) | 800 | 800 | 1000 | 1000 | 1250 | 1680 |
| Standard Finished Size |
4-104um 150-3000 mesh |
|||||
| Capacity(t/h) | 0.5-5.5 | 0.5-5.5 | 1.2-10 | 1.2-11 | 2.5-20 | 5-45 |
| Overall Dimension | 8605*4139*6050 | 10454*3393*6626 | 14507*3633*7562 | 14362*4200*7562 | 19261*4406*8591 | 25067*5414*9007 |
| Main Motor Power(KW) | 75 | 75 | 132/75*2 | 132/75*2 | 185 | 315 |
Extra income from higher production capacity. Money saved from lower electricity bills. Reduction in labor and maintenance costs. Loss reduction from lower defective rate. Less lost profit from reduced downtime.
Divide total investment by annual net benefit. You get the real payback period.
For mineral powder processing equipment, 2–3 years payback is reasonable. You should think twice if it takes more than 5 years. Also leave some buffer for unexpected costs during installation and commissioning.
5.Repair, rebuild or replace? Pick the right option
Not all old equipment needs full replacement. You have three options for most cases: repair, rebuild and replace. Pick the one that fits your situation.1\ Repair works for small, isolated faults.
You only replace the broken parts. It costs the least and takes the shortest time. It is suitable for machines that are still in good overall condition. But repair does not solve fundamental performance problems. You cannot expect big efficiency or capacity gains from simple repairs.If you need any help, feel free to contact us!
2\ Rebuild means overhauling major systems of the mill.
You replace key wear parts and upgrade specific modules. For example, you can rebuild the classifier system or the control system. It costs more than simple repair, but much less than full replacement. It works well when the main mechanical structure is still sound. It can target specific performance bottlenecks without full replacement.3\ Replace means buying a whole new mill or production line.
It brings the latest technology, highest efficiency and longest service life. It also costs the most and needs longer installation time. It is suitable when you need a big capacity increase. It is also the better choice when multiple output grades are needed.To verify your powder grades? You may check the following table.
| Method | Suitable particle shapes | Size range of analyzed particles* | Analysis matrix | Method principle | Measured parameters |
| Laser diffraction (LD) | Spherical | 0.010 µm to 2000 µm | Dry powders or dispersions | Scattering/diffraction pattern | Equivalent spherical diameter |
| Dynamic light scattering (DLS) | Spherical | 0.3 nm to 10 μm | Dispersions | Brownian motion | Hydrodynamic size |
| Single particle optical sensing (SPOS) | Spherical | 0.5 µm to 400 µm | Dispersions | Light obscuration and/or light scattering | Equivalent spherical diameter, particle number concentration |
| Size and shape analyzer | All shapes | 2 to 3000 μm | Dispersions | Image analysis | Equivalent spherical diameter, length, width, aspect ratio, etc. |
| SEM | All shapes | > 10 nm | Dry powders | Image analysis | Diameter, width, length, aspect ratio; information about surface morphology |
| Mechanical sieve analysis | All shapes | 30 µm to 120 mm | Dry powders | Gravimetric analysis | Weight retained on each sieve |
| Air jet sieve analysis | All shapes | > 20 µm | Dry powders | Gravimetric analysis | Weight retained on the sieve |
6.Common pitfalls to avoid
Meanwhile, there are also a few common mistakes people make in mill upgrade projects. Watch out for these.First, only compare purchase price.
Many people only look at how much the new machine costs. They ignore the old machine’s ongoing costs and the new machine’s savings. This leads to wrong decisions.If you need any specific price , please contact us!
Second, overestimate expected capacity gain.
New mill performance depends on matching supporting equipment and raw material conditions. Ideal parameters from brochures are hard to achieve in real production. Leave some margin in your calculation.Third, ignore downtime during replacement.
Replacing a mill takes time for dismantling, installation and commissioning. Production stops during this period. Include this loss in your total cost calculation. A rebuild or partial upgrade often causes much shorter downtime.Fourth, ignore future production needs.
If your business is growing, pick a model with some room for expansion. Otherwise you may face another upgrade soon after.If you need a free assessment of your old mill or trade-in solution advice, contact our technical team.
FAQ
Q1: How is an old grinding mill valued for trade-in?
Most suppliers value mills based on model, age, working condition and remaining service life. Some offer fixed percentage discounts for specific old models. On-site evaluation is common for large heavy equipment.Q2: Can I just replace the main mill without upgrading the whole line?
It depends on your current supporting equipment. If the classifier, dust collector and control system can match the new mill, you can replace only the main unit. But performance gains will be limited. Mismatched supporting equipment can hold the new mill back.Q3: Is it better to upgrade the old mill or buy a new one?
For mills under 10 years old with sound main structure, partial upgrades like classifier replacement can be cost-effective. For old mills with high energy use, frequent failures and multiple system problems, trade-in for a new one usually gives better long-term returns.Q4: Can trade-in discounts stack with other promotional offers?
Policies vary by supplier. Many suppliers do not allow stacking. Confirm this with your supplier before you make the deal. Always compare the final total price.Q5: What is the 50% rule for equipment replacement?
The 50% rule says replacement is recommended when annual repair cost exceeds 50% of the price of a new equivalent machine. Repair costs typically rise with equipment age and often jump fast after a certain point.Q6: How long is a reasonable payback period for a grinding mill upgrade?
For mineral powder grinding equipment, a payback period of 2–3 years is considered good. You should carefully re-evaluate if the projected payback exceeds 5 years.Related Newsmore >>
- CLIRIK Exhibition Preview: Join Us at CHINACOAT & SFCHINA 2026 in Guangzhou2026-09-15
- What to Consider Before Replacing Your Old Mill?2026-09-10
- Intro Investing in a non-metallic mineral powder plant has become one of the most attractive opportu2026-09-10
- Calcium Carbonate Masterbatch: What It Is and How to Use It2026-09-09
- CLIRIK Mid-Autumn Festival 2026 Holiday Preview2026-09-07
- Oyster Shell HGM Ultrafine Mill for Circular Economy2026-09-04