Particle Size Distribution (PSD) Technical Guide
Source:clirikb
Posted:2026-10-15
High-end plastics, premium coatings and advanced paper all need high-end powder.
Downstream buyers no longer accept rough "mesh count" quality.
They ask for precise Particle Size Distribution (PSD).
Many powder producers still rely on average size or a single mesh number.
This may causes quality dispute.
This guide is going to explain PSD in plain language.
It begin with focusing on the most common used method: laser diffraction.

We will use a real diatomite test report as an example.
We will also shows how HGM ring roller mills control PSD.
It shows what share of particles in a powder sample falls into each size range.
Real powder contains countless particles of different sizes.
No single diameter can describe a whole batch.
PSD uses statistics to map the full size composition.

PSD always has three types, each based on what you count.
1\ Volume-based PSD counts by particle volume share.
This is the industry standard for mineral powders.
Downstream formulas dose by mass or volume.
Volume PSD links directly to filling efficiency.
It is the default for ground calcium carbonate, calcite, talc and other fillers.

2\ Other methods: Number-based PSD counts by particle number.
It is used mostly for nanomaterials and aerosols.
3\ Other methods: Area-based PSD counts by particle surface area share.
It is used for catalysis and adsorption work.
PSD also comes with two display forms.
1\Differential distribution
It shows the share in each size interval.
It reveals the peak shape and distribution width.

2\Cumulative distribution shows the total share smaller than a given size.
D10, D50 and D97 all come from this curve.

Laser diffraction covers over 75% of industrial quality control.
It is the gold standard for industrial production lines like HGM ring roller mill .
We will focus on laser diffraction in this guide.
It will be the method you see on most mill test reports.
Different particle sizes scatter light at different angles.
A ring of light sensors captures the scatter pattern.
Math software rebuilds the full PSD curve.
Some basic index:
1\ The method works from 0.1 µm to 3 mm.
That covers nearly all ultrafine mineral powders.
2\ A full test takes 1 to 3 minutes.
Results are repeatable. You get the full PSD curve and all key diameters. It supports dry and wet modes.
3\ HGM lines use dry laser diffraction for factory checks.
They also use it for in-process control. Dry laser diffraction volume results are the acceptance standard for GCC, calcite and petroleum coke.
Let us walk through a real laser diffraction report. It tested a diatomite sample.
Now look at the D-values.
Most important D-values Parameter
2\ D50(median) is 13.55 µm. This means half the powder volume is smaller than 13.55 µm. This is the median. It tells you the overall fineness at a glance.
3\ D97 is 28.05 µm. Only 3% of the volume is coarser than this. It shows the coarse tail. D97 is the number buyers watch most for defect control.
Above all, PSD gives you a quality fingerprint. D10 links to surface area and oil absorption. D50 links to overall fineness and flowability. D97 links to defect control. Span measures distribution width.
Other index for reference:
4\ Span is 1.27.
The formula is Span = (D90 − D10) / D50. Here (23.90 − 6.670) / 13.55 = 1.27. A span of 1.27 is fairly narrow. It means the particles are reasonably uniform. A broad span would be 2.0 or higher.
5\ Obscuration is 11.77%.
This is a good level for wet laser tests. Too low means too little sample. Too high causes multiple scattering. 10–15% is the sweet spot.
6\ Residual is 3.901%.
This shows how well the Mie model fits the scatter data. Under 5% is typical. Higher residual means the model or dispersion needs work.
Interval-by-interval Data
The cumulative column climbs as you move up in size.
By 8.660 µm, cumulative is 25.23%.
By 15.99 µm, cumulative is 60.25%.
By 23.11 µm, cumulative is 87.82%.
By 33.40 µm, cumulative hits 100%.
This is what a real PSD curve looks like behind the numbers.

No single "mesh size" can show this shape.
Volume mean D[4,3] is not the same as area mean D[3,2].
Number mean is different again. Confusion over these causes quality disputes.
The bigger problem is this.
One average number hides distribution width and coarse tails. It can mask serious quality risks.
Look at the diatomite report. Volume mean D[4,3] is 14.46 µm. But D97 is 28.05 µm.
That means a small but real fraction of particles is twice the median.

If you only quoted D[4,3] = 14.46 µm, a buyer would never know the coarse tail.
Two batches can share the same average. Batch A is nearly uniform from 8 to 12 µm. Batch B mixes 90% fine powder with 10% coarse particles.
Same average. Totally different performance. Batch B's coarse particles cause coating defects and film pinholes.
Single mesh count has the same problem. Mesh count means the number of sieve holes per inch.
It is just a threshold. It tells you what share exceeds a certain size. It says nothing about the rest.
Below 1250 mesh (10 µm), sieves clog badly. Particles agglomerate. Results are unreliable.
This is the mainstream technology for 150–3000 mesh ultrafine powder.
Raw material enters the grinding chamber. Grinding rings and rollers crush it by compression and shear.
Upward airflow carries ground material into the classifier.

Inside the classifier, a high-speed rotor forms a stable centrifugal field.
Particles feel two opposite forces. Air drag pulls fine particles toward the center.
Centrifugal force flings coarse particles toward the wall.

When centrifugal force beats drag, coarse particles hit the wall.
They slide down and go back to the grinding chamber. They get re-ground.
When drag beats centrifugal force, fine particles pass through the rotor.
Airflow carries them to the pulse dust collector. They become finished product.
The cut size depends on rotor speed and air volume.
Higher rotor speed gives finer cut. More airflow gives coarser cut.
Operators tune these two to hit target D50 and D97.
PSD means Particle Size Distribution. It shows the share of particles of different sizes in a powder sample.
D10 is the fine end, D50 is the median, D97 is the coarse upper limit.
Only 3% of particles are larger than D97.
Look at span for distribution width.
A tiny share of oversized particles causes big defects while barely moving the average.
Below 1250 mesh, sieves clog and results become unreliable.
Fine particles pass through. Rotor speed and air volume set the cut size.
Lower span means more uniform particles. A value around 1.2–1.5 is considered narrow for mineral fillers.
Downstream buyers no longer accept rough "mesh count" quality.
They ask for precise Particle Size Distribution (PSD).
Many powder producers still rely on average size or a single mesh number.
This may causes quality dispute.
This guide is going to explain PSD in plain language.
It begin with focusing on the most common used method: laser diffraction.
We will use a real diatomite test report as an example.
We will also shows how HGM ring roller mills control PSD.
1.What Is Particle Size Distribution?
PSD is a statistical description.It shows what share of particles in a powder sample falls into each size range.
Real powder contains countless particles of different sizes.
No single diameter can describe a whole batch.
PSD uses statistics to map the full size composition.
PSD always has three types, each based on what you count.
1\ Volume-based PSD counts by particle volume share.
This is the industry standard for mineral powders.
Downstream formulas dose by mass or volume.
Volume PSD links directly to filling efficiency.
It is the default for ground calcium carbonate, calcite, talc and other fillers.
2\ Other methods: Number-based PSD counts by particle number.
It is used mostly for nanomaterials and aerosols.
3\ Other methods: Area-based PSD counts by particle surface area share.
It is used for catalysis and adsorption work.
PSD also comes with two display forms.
1\Differential distribution
It shows the share in each size interval.
It reveals the peak shape and distribution width.
2\Cumulative distribution shows the total share smaller than a given size.
D10, D50 and D97 all come from this curve.
2.Common PSD Testing Methods and Equipment
The powder industry uses several standardized test methods.Laser diffraction covers over 75% of industrial quality control.
It is the gold standard for industrial production lines like HGM ring roller mill .
| Method | Common Equipment | Size Range | Best For | Limitation |
| Laser diffraction | Bettersize BT-9300ST, Malvern Mastersizer, Beckman Coulter LS | 0.01 µm – 3 mm | Dry or wet mineral powder QC | Needs correct refractive index input |
| Mechanical sieve | Standard woven test sieves (20 µm – 120 mm) | Coarse powders > 38 µm | Rough grading, not ultrafine | Clogs, no continuous curve |
| Other Methods | Alpine air jet sieve | > 20 µm | Agglomerating powders | Only one threshold at a time |
It will be the method you see on most mill test reports.
3.Laser Diffraction: The Main Method
Laser diffraction shines a parallel laser beam at dispersed powder.Different particle sizes scatter light at different angles.
A ring of light sensors captures the scatter pattern.
Math software rebuilds the full PSD curve.
Some basic index:
1\ The method works from 0.1 µm to 3 mm.
That covers nearly all ultrafine mineral powders.
2\ A full test takes 1 to 3 minutes.
Results are repeatable. You get the full PSD curve and all key diameters. It supports dry and wet modes.
3\ HGM lines use dry laser diffraction for factory checks.
They also use it for in-process control. Dry laser diffraction volume results are the acceptance standard for GCC, calcite and petroleum coke.
3.1A Real Report Example: Diatomite Powder
Let us walk through a real laser diffraction report. It tested a diatomite sample.
3.2Key Numbers on the Report
The summary section gives several useful values.| Parameter | Value (this diatomite sample) | What it means |
| Volume mean D[4,3] | 14.46 µm | Average by volume |
| Area mean D[3,2] | 11.56 µm | Sauter mean |
| Length mean D[2,1] | 9.354 µm | Mean by length |
| Number mean D[1,0] | 7.943 µm | Mean by count |
| Specific surface area | 192.2 m²/kg | Surface per kg |
| Span | 1.27 | Distribution width |
| Obscuration | 11.77% | Concentration check |
| Residual | 3.901% | Fit quality |
Most important D-values Parameter
| Particle size parameters | particle size(µm) |
| D10 | 6.670 |
| D50 | 13.55 |
| D90 | 23.90 |
| D97 | 28.05 |
3.3How to Read These Numbers
1\D10 is 6.670 µm. Only 10% of the volume is finer than this. It shows the fine end. A low D10 means more ultrafine particles. That raises surface area and oil absorption.2\ D50(median) is 13.55 µm. This means half the powder volume is smaller than 13.55 µm. This is the median. It tells you the overall fineness at a glance.
3\ D97 is 28.05 µm. Only 3% of the volume is coarser than this. It shows the coarse tail. D97 is the number buyers watch most for defect control.
Above all, PSD gives you a quality fingerprint. D10 links to surface area and oil absorption. D50 links to overall fineness and flowability. D97 links to defect control. Span measures distribution width.
Other index for reference:
4\ Span is 1.27.
The formula is Span = (D90 − D10) / D50. Here (23.90 − 6.670) / 13.55 = 1.27. A span of 1.27 is fairly narrow. It means the particles are reasonably uniform. A broad span would be 2.0 or higher.
5\ Obscuration is 11.77%.
This is a good level for wet laser tests. Too low means too little sample. Too high causes multiple scattering. 10–15% is the sweet spot.
6\ Residual is 3.901%.
This shows how well the Mie model fits the scatter data. Under 5% is typical. Higher residual means the model or dispersion needs work.
3.4What the Frequency Table Tells You
The report also lists interval-by-interval data. For example:Interval-by-interval Data
| Lower Bound (µm) | Upper Bound (µm) | Volume Percentage (%) |
| 7.660 | 8.660 | 7.47 |
| 8.660 | 9.791 | 7.30 |
| 9.791 | 11.06 | 6.72 |
| 11.06 | 12.51 | 6.43 |
| 12.51 | 14.14 | 6.70 |
| 14.14 | 15.99 | 7.87 |
| 15.99 | 18.07 | 9.17 |
| 18.07 | 20.44 | 9.67 |
| 20.44 | 23.11 | 8.73 |
By 8.660 µm, cumulative is 25.23%.
By 15.99 µm, cumulative is 60.25%.
By 23.11 µm, cumulative is 87.82%.
By 33.40 µm, cumulative hits 100%.
This is what a real PSD curve looks like behind the numbers.
No single "mesh size" can show this shape.
4.Why Average Size and Single Mesh Are Not Enough
Average particle size is a single number. Different calculation methods give different results.Volume mean D[4,3] is not the same as area mean D[3,2].
Number mean is different again. Confusion over these causes quality disputes.
The bigger problem is this.
One average number hides distribution width and coarse tails. It can mask serious quality risks.
Look at the diatomite report. Volume mean D[4,3] is 14.46 µm. But D97 is 28.05 µm.
That means a small but real fraction of particles is twice the median.
If you only quoted D[4,3] = 14.46 µm, a buyer would never know the coarse tail.
Two batches can share the same average. Batch A is nearly uniform from 8 to 12 µm. Batch B mixes 90% fine powder with 10% coarse particles.
Same average. Totally different performance. Batch B's coarse particles cause coating defects and film pinholes.
Single mesh count has the same problem. Mesh count means the number of sieve holes per inch.
It is just a threshold. It tells you what share exceeds a certain size. It says nothing about the rest.
Below 1250 mesh (10 µm), sieves clog badly. Particles agglomerate. Results are unreliable.
5.How HGM Air Classifier Controls PSD?
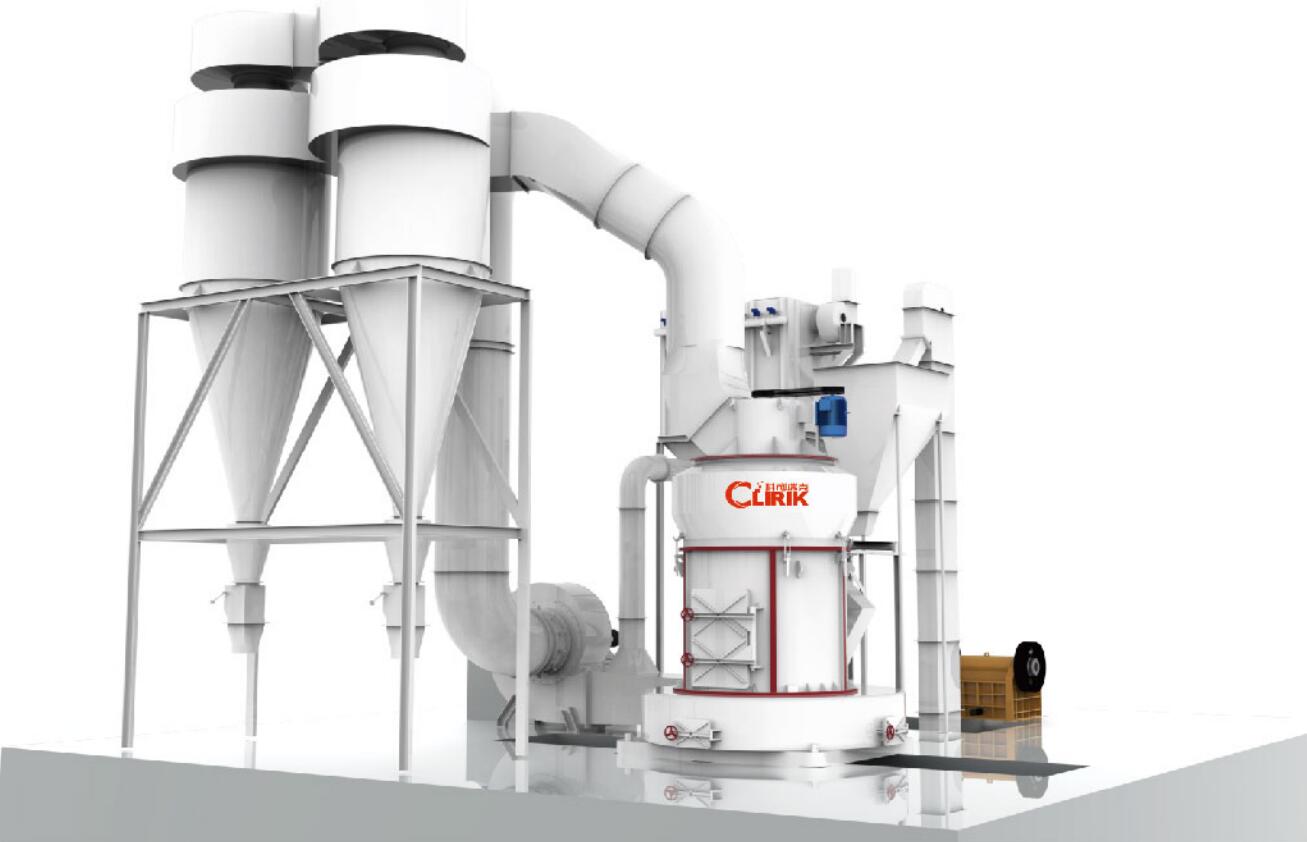
HGM ultrafine ring roller mills use sealed centrifugal grinding. They pair it with a high-pressure air classifier.This is the mainstream technology for 150–3000 mesh ultrafine powder.
Raw material enters the grinding chamber. Grinding rings and rollers crush it by compression and shear.
Upward airflow carries ground material into the classifier.
Inside the classifier, a high-speed rotor forms a stable centrifugal field.
Particles feel two opposite forces. Air drag pulls fine particles toward the center.
Centrifugal force flings coarse particles toward the wall.
When centrifugal force beats drag, coarse particles hit the wall.
They slide down and go back to the grinding chamber. They get re-ground.
When drag beats centrifugal force, fine particles pass through the rotor.
Airflow carries them to the pulse dust collector. They become finished product.
The cut size depends on rotor speed and air volume.
Higher rotor speed gives finer cut. More airflow gives coarser cut.
Operators tune these two to hit target D50 and D97.
FAQ
Q1: What does PSD stand for?
PSD means Particle Size Distribution. It shows the share of particles of different sizes in a powder sample.
Q2: What is the best way to measure ultrafine mineral powder?
Laser diffraction is the industry standard. Tests take 1–3 minutes and give a full PSD curve.Q3: What do D10, D50 and D97 mean?
They are cumulative volume diameters.D10 is the fine end, D50 is the median, D97 is the coarse upper limit.
Only 3% of particles are larger than D97.
Q4: How do I read a laser diffraction report?
Start with D50 for overall fineness. Check D97 for the coarse tail.Look at span for distribution width.
Q5: Why is average particle size not enough?
One number hides distribution width and coarse tails.A tiny share of oversized particles causes big defects while barely moving the average.
Q6: Can sieve mesh count replace PSD?
No. Mesh count only gives one threshold.Below 1250 mesh, sieves clog and results become unreliable.
Q7: How does an HGM mill control PSD?
A high-speed air classifier creates a centrifugal field. Coarse particles return for re-grinding.Fine particles pass through. Rotor speed and air volume set the cut size.
Q8: What is span?
Span = (D90 − D10) / D50. It measures distribution width.Lower span means more uniform particles. A value around 1.2–1.5 is considered narrow for mineral fillers.
Related Newsmore >>
- Particle Size Distribution (PSD) Technical Guide2026-10-15
- CLIRIK Double Ninth Festival 2026 Message2026-10-12
- Calcium Carbonate Modification: Functions and Downstream Application Analysis2026-10-10
- Complete Production Line from Limestone Raw Material to Ultrafine Modified Powder2026-10-09
- CLIRIK 2026 National Day Holiday Notice2026-10-01
- A Complete Plant Configuration for Ultrafine Calcium Carbonate Processing2026-09-28